Article
How accurate is aerial roof measurement? What 40 houses showed
We measured outer gutter length from aerial imagery for a US gutter company. Here is how it works, how close it got on real houses, and where it breaks.
Before a gutter company can send a quote, it needs one number: how many feet of gutter the house needs along its outer roof edge. Getting that number usually means sending someone to the property or buying a measurement report for every address. Both take time, and both add up when a sales team is quoting many houses a week.
I recently built a system for a US home-services company that sells and installs gutters. It takes an address and returns the outer gutter length in linear feet, using aerial imagery and elevation data that already exist. This article explains how aerial roof measurement works, how accurate it was when we tested it against professional measurements on real houses, and which errors to ask about before you trust any aerial measurement enough to quote from it.
What aerial roof measurement uses
Three inputs do almost all the work.
- A high-resolution aerial photo (an orthophoto). In the urban areas we worked with, each pixel covered about 7.5 cm of ground, which is comparable to a high-end drone survey. The photo shows the roof outline clearly, but a photo alone cannot tell you which way a roof slopes.
- A surface elevation model. This is a height map with a value for every point of the surface, including roofs, trees, and neighboring buildings. It is what lets software see that one side of a roof falls toward the street and the other toward the backyard. Because it is built from overlapping photos and includes everything on the ground, it is noisier than a laser-scanned terrain model.
- A building footprint. This is the outline of the building, delivered with the imagery or taken from municipal data. It tells the system where the house is and gives it a starting shape for the roof edge.
From the customer's side, the input is only an address. The system geocodes it, downloads imagery for a small area around the building, and caches the download so the same property is never purchased twice. If your measurement depends on paid data, that last detail is worth asking about.
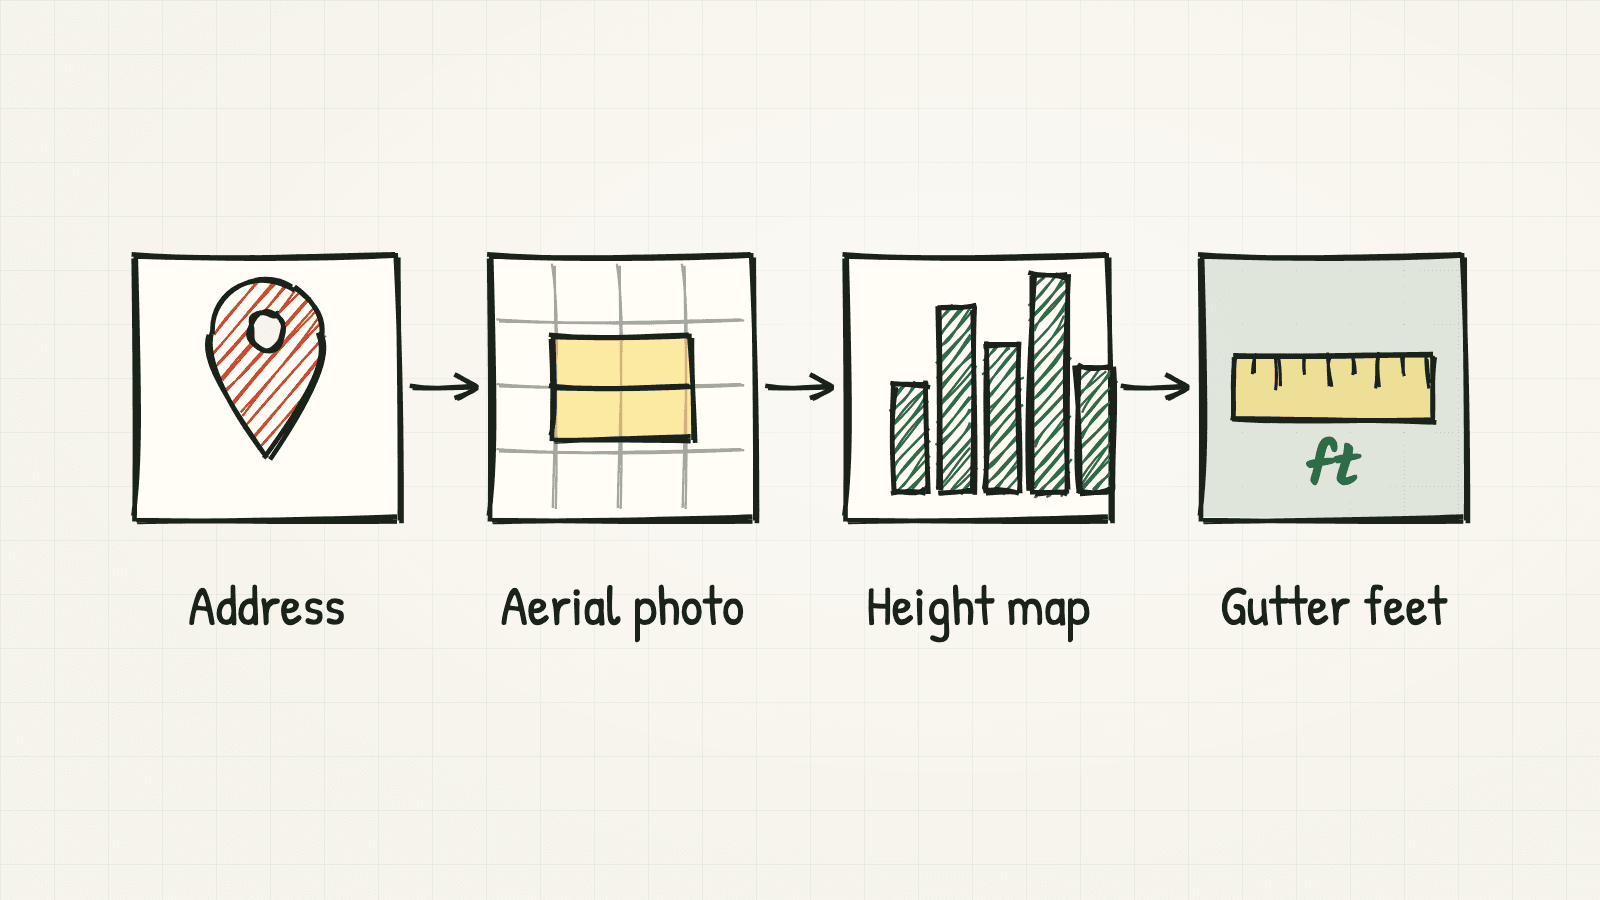
From address to gutter feet. Imagery is downloaded once per property and reused from a cache.
How software decides where gutters go
A gutter belongs on an edge where rainwater leaves the roof. That gives a rule simple enough to explain to a homeowner: if water runs across an edge, the edge needs a gutter, and if water runs along the edge, it is a gable end and needs none.
To apply the rule, the system walks around the roof edge and, for each section, fits a small flat plane to the elevation data just inside the edge. The tilt of that plane says which way water runs. The system then compares the direction of runoff with the direction of the edge. Chimneys, vents, and overhanging branches show up as height outliers, so the fit rejects the worst points once and fits again.
Two practical details matter on real roofs.
- Long edges are split where the roof changes. A single straight wall can sit under both an eave and a gable. One plane fitted across both would describe neither, so the system cuts an edge only where the downhill direction actually turns. A simpler approach that chopped edges into fixed lengths was tested in an A/B comparison and rejected.
- Flat sections default to gutter. A low-slope roof still needs a perimeter gutter, so an edge with no clear slope is counted.
A final smoothing step looks along the ring of edges and removes single-edge flips at corners, while leaving long, unambiguous runs alone.
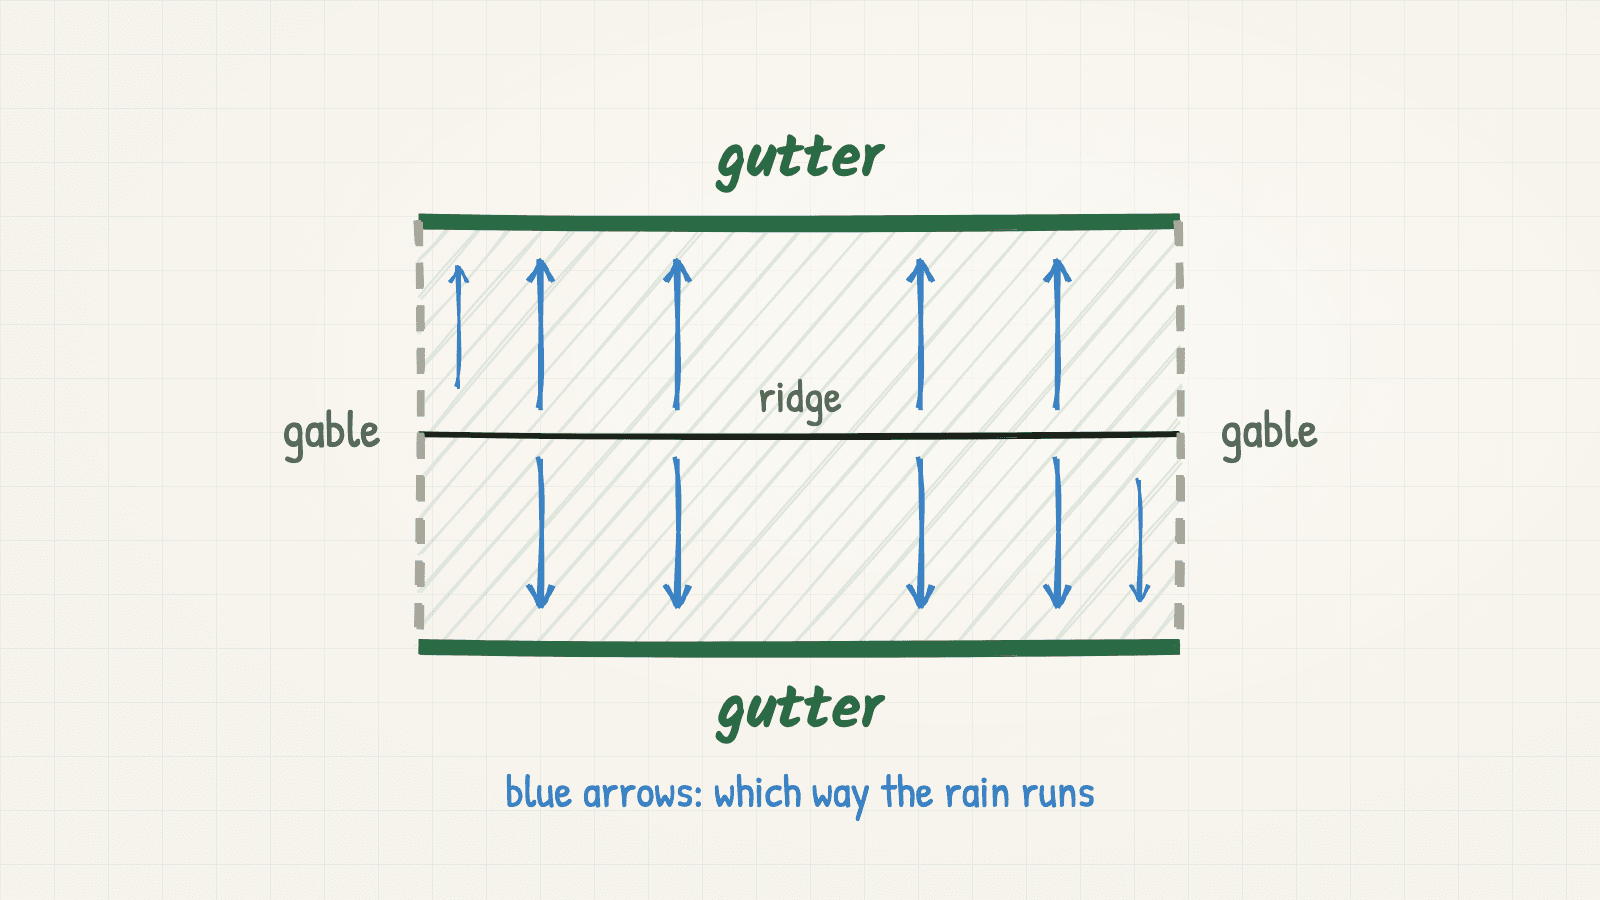
A simple gable roof from above. Rain runs from the ridge across the long edges, so those get gutters. Along the short gable edges, water runs parallel to the edge.
The map projection error that inflates every length
Aerial imagery and web maps are often delivered in a projection called Web Mercator, the same one most online maps use. It keeps shapes looking right, but it stretches distances as you move away from the equator. The stretch is roughly one divided by the cosine of the latitude. Around Houston, at about 30° north, lengths read about 15% long. At San Francisco, at about 38° north, map coordinates overstated ground distance by about 27% and areas by about 60%. Further north, the error keeps growing.
We confirmed the effect by comparing computed footprint areas with the areas reported by the imagery provider, then converted every length to true ground units for each site. If a measurement tool quotes linear feet from Web Mercator coordinates and never mentions the projection, its numbers are off by a latitude factor.
For a business, this kind of error never appears as a warning. It appears as quotes that are consistently high, and a customer comparing bids may notice it before you do.
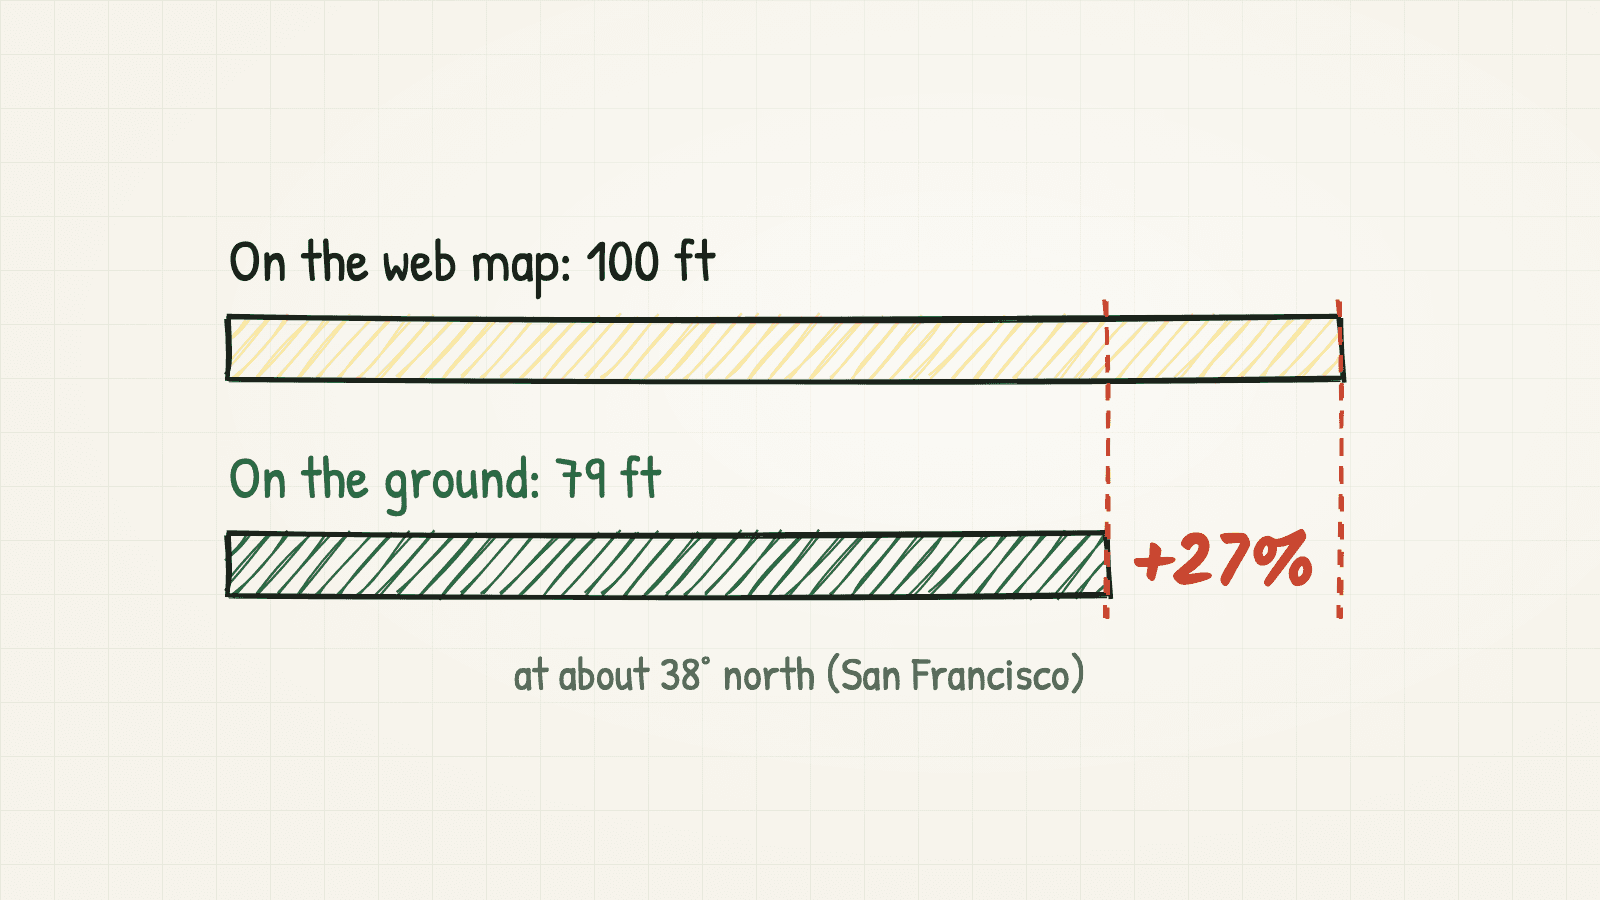
The same roof edge measured on a web map and on the ground at San Francisco's latitude.
How accurate it was on real houses
We judged accuracy on one number: outer horizontal gutter length, compared with professional measurement reports for the same houses. Before building the production version, the client and I agreed on the bar: at least 80% closeness in the worst case and 90% in the best case.
- San Francisco, 4 houses. Two were within ±5% of the reference, and the mean absolute error was 7.1%. Both misses were undercounts.
- Texas, 40 houses. 34 of 40 (85%) were within 20% of the reference outer gutter length, and 22 of 40 (55%) were within 10%. The median absolute error was 9.2% and the mean was 13.3%.
The gap between the median and the mean is worth noticing. Most houses landed close, and a small number of large misses pulled the average up. When a vendor gives you a single accuracy figure, ask for the distribution as well.
We also used a simple rule while improving the method: a change was accepted only if no house already inside the 20% band fell out of it. A better average can hide new failures, and this rule kept them visible.
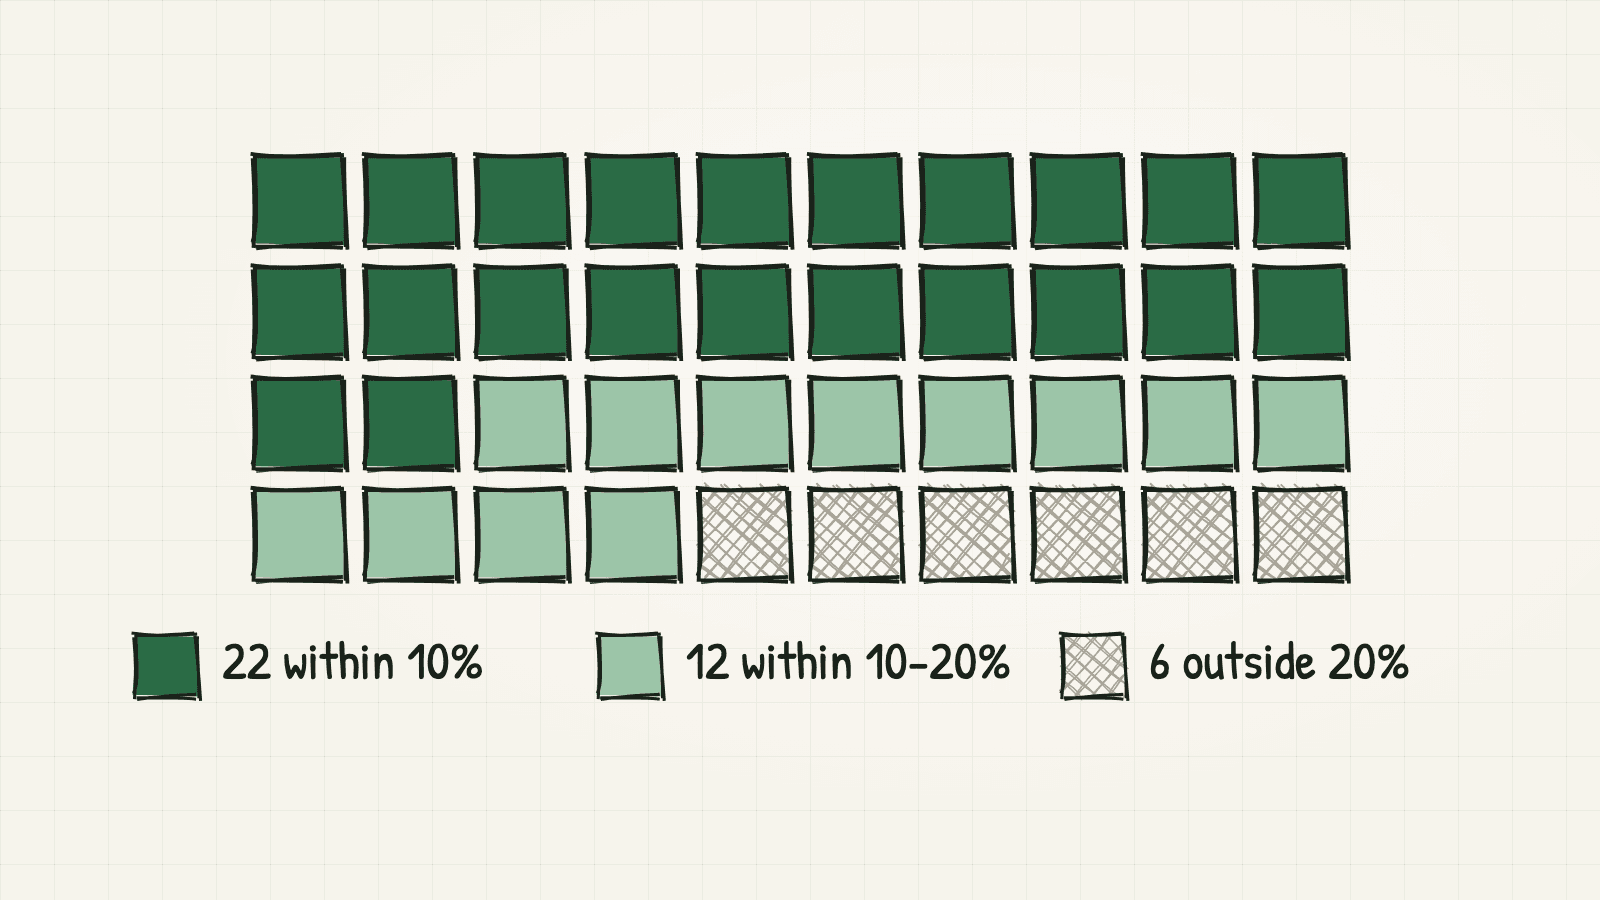
Texas evaluation: 22 houses within 10%, 12 between 10% and 20%, and 6 outside 20%.
Where aerial measurement breaks
Every miss in the evaluation had a cause we could name, and most of them traced back to the input data.
- Roof missing from the footprint. On one San Francisco house, every edge of the building footprint was already counted as gutter, and the result was still 18% short. A real section of hip roof sat outside the footprint. No classifier can count an edge that the outline does not contain.
- Wall line versus drip edge. Footprints often trace the walls, while gutters hang at the roof edge, which overhangs the wall. On another house this left the measurement about 9% short. A fixed offset closed most of that gap but was unstable on buildings with more complex outlines, so it stays switched off by default.
- Coverage limits. The 6 Texas houses outside the 20% band had footprint or elevation data that did not describe the same roof edge the reference report measured.
- A wrong answer key. Some apparent misses came from the reference itself. The reports include gutters on dormers and upper roofs in their total, while the system measures only the outer edge. After the reference was corrected for two houses, the same predictions matched at 99.6% and 90.8%. I will write about this one separately, because it applies to almost every AI evaluation.
Both San Francisco misses were undercounts, which is the pattern you would expect when the input data is missing part of the roof edge. Knowing the direction of an error is often as useful for pricing as knowing its size.
Why the simpler method went to production first
There are two ways to approach this problem. The first treats the building footprint as the roof edge and uses the elevation data only to decide gutter or gable for each edge. The second reconstructs the full roof from the imagery: faces, ridges, valleys, and eaves. We built both. The second is more faithful on complex roofs and is the path to higher precision. The first was fast and repeatable on typical residential roofs and met the agreed bar, so it went to production, with full reconstruction kept as an optional later phase.
The trade-off is explicit. The production method measures the outer edge only, and it is limited by how complete the footprint is. For a quoting tool, that was a sensible first step. A product that needs inner roofs and dormers would need the full reconstruction.
Questions to ask before you quote from aerial measurements
If you are evaluating an aerial measurement tool, or thinking about building one, these questions will tell you most of what you need to know.
- Which length is being measured? Check whether it is the outer edge only or every gutter run, including dormers and upper roofs, and make sure the tool and your reference measure the same thing.
- How was accuracy tested? Ask for the number of houses, the reference used, and the full distribution of errors as well as the average.
- Are lengths corrected for the map projection? If the answer is unclear, compare a few measured lengths against a tape measure or a known plan.
- What happens when the building outline is incomplete or the roof overhangs? A good answer names the failure and says which direction it errs in.
- Do you pay for imagery every time? If so, ask whether results are cached per property.
- Which roofs are out of scope? Complex roofs with inner runs need more than an outer-edge method.
Frequently asked questions
Is aerial roof measurement accurate enough to quote from?
It depends on the roof and the data. On our 40-house Texas set, 85% of measurements were within 20% of professional reports and 55% were within 10%. Whether that is enough depends on the margin in your pricing and on how you handle the houses that fall outside the band.
Does it work on complex roofs?
The production method we used measures the outer edge and works best on typical residential roofs. Inner roofs, dormers, and complex multi-level roofs need a full roof reconstruction, which is a larger piece of work.
What image resolution did you use?
About 7.5 cm per pixel in urban areas, from commercial aerial imagery, together with a surface elevation model.
Closing thought
Aerial measurement is most useful when its limits are written down next to its numbers. Used that way, it can turn the measurement step from a per-house cost into something a system produces in the background, and it shows people exactly which houses need a closer look. You can see other location-intelligence systems I have built on the projects page.
If your business measures something before every quote and you are wondering whether imagery or other data could do that work, message me on LinkedIn. I'd like to hear how you do it today.
Related posts
- Your CRM doesn’t remember why you passed on the deal
Land teams lose judgment in chat and spreadsheets. Here’s how GIS-backed parcel intelligence keeps deal memory inside the firm without replacing your CRM.